Leisure and Recreation was Out-Of-Home’s Largest Vertical in 2012
The $1.8 billion of leisure/recreation advertising on Out-of-Home media was its largest vertical, representing 25% of total Out-of-Home advertising in 2012, according to BIA/Kelsey’s Media Ad View Plus. The Finance/Insurance vertical was the second highest, with 10% of total Out-of-Home advertising in 2012.
BIA/Kelsey projects Out-of-Home advertising revenue to grow from $7.3 billion in 2012 to $9.0 billion in 2017, a compound annual growth rate (CAGR) of 4.3%.
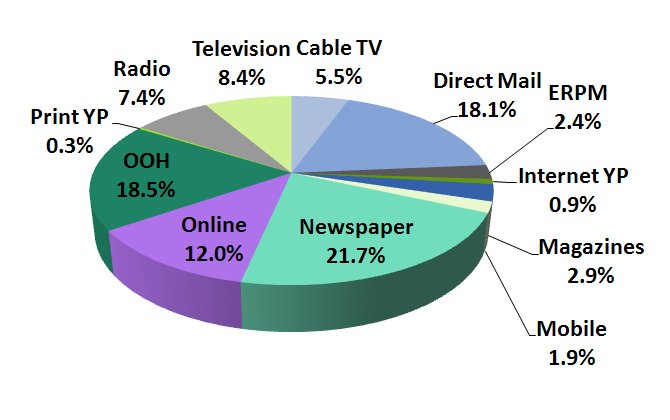
While leisure/recreation was Out-of-Home’s biggest spending vertical, more leisure/recreation advertising dollars went to newspaper in 2012 than Out-of-home. In 2012, Out-of-Home Advertising was the second highest media among Leisure/Recreation advertising, according to Media Ad View Plus, with 18.5% of the vertical’s advertising spend. Newspaper accounted for 21.7% of the vertical’s advertising spend. However, as newspaper’s advertising revenue continues to decline, BIA/Kelsey projects leisure/recreation spending on out-of-home will outpace newspaper in 2014.
2012 Leisure/Recreation Ad Spending by Media

Media Ad View Plus breaks the Leisure/Recreation vertical into 10 subcategories: Traveler Accommodation (Hotels-Motels); Airline Transportation; RV (Recreational Vehicle) Parks and Recreational Camps; Performing Arts Companies; Spectator Sports; Museums, Historical Sites, and Similar Institutions; Amusement Parks and Arcades; Gambling Industries; Other Amusement and Recreation Industries; and Motion Picture and Video Exhibition. In 2012, Traveler Accommodation (Hotels-Motels) accounted for more than 35% of the spending on Out-Of-Home advertising in the Leisure-Recreation vertical.
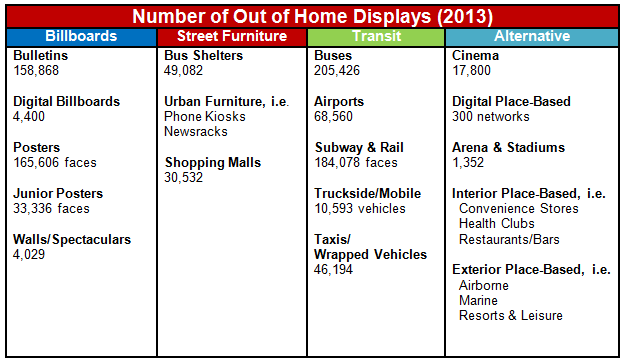
The Out-of-Home advertising medium includes more than just billboards. The chart below, from the Outdoor Advertising Association of America (OAAA), shows the different Out-of-Home displays available to advertisers.

Source: OAAA
According to OAAA, billboards accounted for 64% of Out-of-Home advertising in 2012, followed by transit with 17%, alternative with 12% and street furniture with 7%.
More information on Media Ad View Plus is available here.
